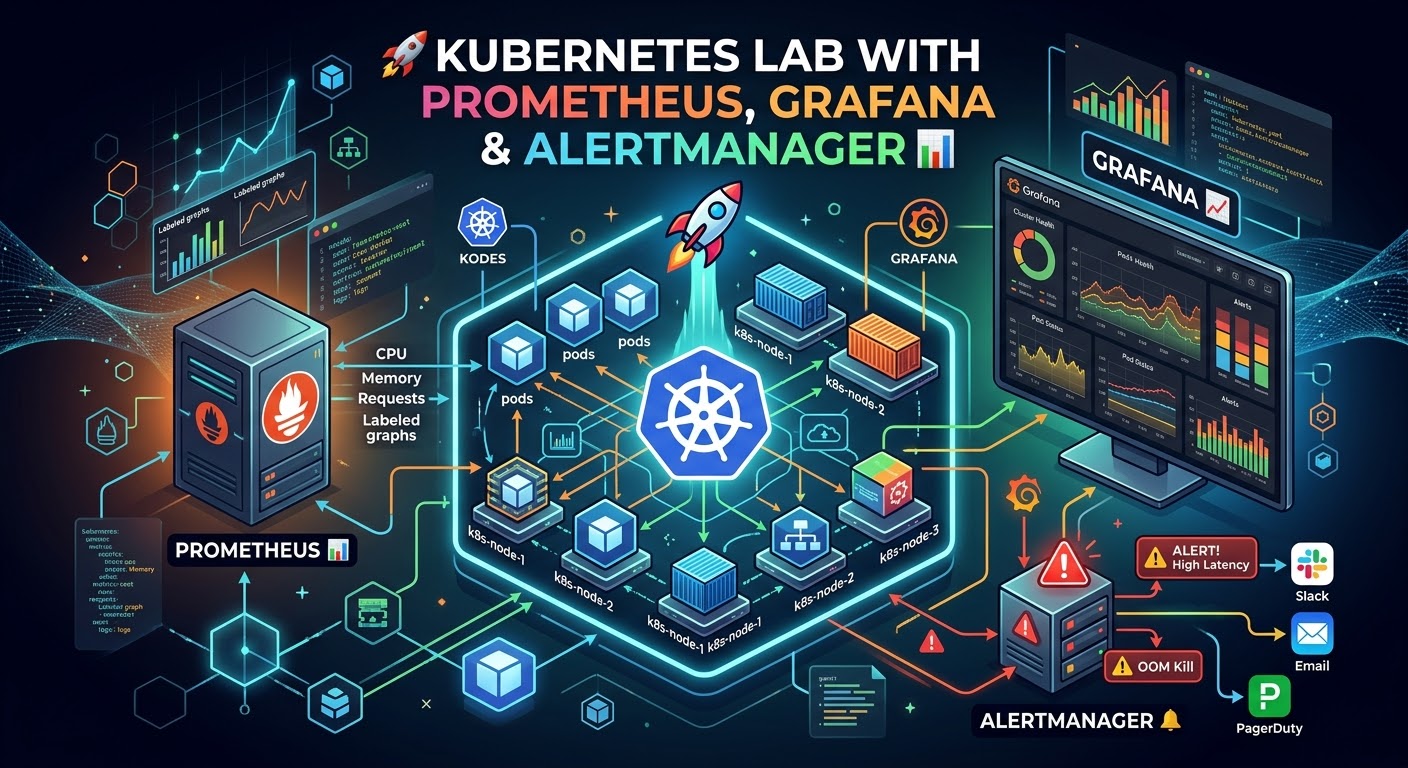
I recently set up a Kubernetes lab to monitor a Node.js application using Prometheus, Grafana, and Alertmanager. This project helped me deepen my understanding of Kubernetes monitoring, alerting, and observability stacks.
In this post, I’ll walk through:
✅ Deploying a Node.js app in Kubernetes
✅ Setting up Prometheus to scrape metrics
✅ Configuring Grafana for visualization
✅ Defining alert rules with Alertmanager
🔹 Why this project?
Observability is key for scalable applications. With Prometheus, Grafana, and Alertmanager, we can:
🔍 Collect detailed metrics
📊 Visualize application & cluster performance
🚨 Set up automated alerts